---Application of Regression Analysis in Stock Return Prediction
On June 30, 2020, Professor Feng Jiarui, Chief Financial Engineering Analyst at Haitong Securities Research Institute, was invited to give a lecture at an industry forum on the theme of "Application of Regression Analysis in Stock Return Prediction" at our institute. Feng Jiarui graduated from Fudan University with a major in Probability Theory and Mathematical Statistics. In 2010, he joined Haitong Securities Research Institute and mainly engaged in research on asset allocation and multi factor stock selection. From 2013 to 2019, it has been selected as the Best Analyst by New Fortune for seven consecutive years.
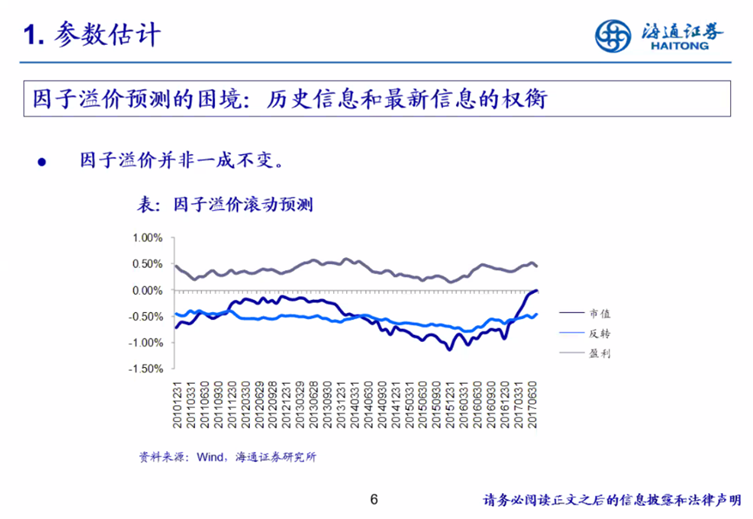
Firstly, Professor Feng Jiarui introduced us to the application of parameter estimation in regression analysis for predicting stock returns. Usually, when selecting stocks, we consider the style of factors such as size and value, returns, volatility, analyst coverage, and industry rotation factors. Ultimately, our target variable is "expected returns". In the regression model, the dependent variable is the return rate of all individual stocks in month t, the independent variable is the factor value of individual stocks at the end of month t-1, and the regression coefficient is the factor premium of factor t in month t. We ultimately use the estimated factor premium coefficient to predict the stock returns for the next month. Therefore, the key is to determine the regression coefficient factor premium. Since a factor premium coefficient can be obtained every month, the average estimation of factor premiums from t-12+1 to t months is usually used. But when the factor premium changes significantly, we believe that a simple weighted average will have bias. At this point, we can adjust the weight coefficients to adjust the proportion of the latest factor premium and historical factor premium in the final factor premium used for prediction. In statistical testing, we divide factors into return factors and risk factors. The factors that can explain the volatility of stock returns in cross-section can be considered as risk factors; Risk factors with robust premiums and reliable economic logic in time series can be considered as return factors. In the final model evaluation stage, we use the correlation coefficient between predicted values and actual values - IC - to evaluate the quality of the model. Generally, when the IC is 20%, the model performance can be considered good.
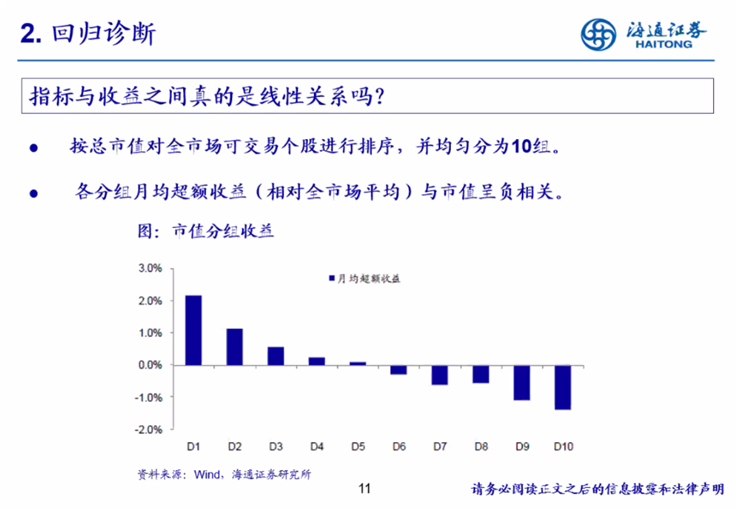
Subsequently, Teacher Feng introduced us to the application of regression diagnosis in stock return prediction. Here, we need to verify whether there is a reliable linear relationship between indicator factors and returns. Firstly, we adopt cross-sectional normalization for the logarithmic total market value of stocks to obtain the Z-score of market value; When z takes positive and negative values respectively, we then calculate the slope values of the fitted lines separately. It should be noted that for stocks with particularly large or small market values, using only one regression curve can lead to significant deviations in predictions (i.e., non complete linearity). At this point, non-linear fitting can be considered. After fitting, we need to draw a residual graph and observe whether it conforms to the distribution of random errors. If there are significant abnormalities, the factors need to be improved. For example, adding non-linear factors such as the square term of the factor for the next step of fitting. And provide the parameter test results of the nonlinear factor during regression to determine whether the factor is significant.
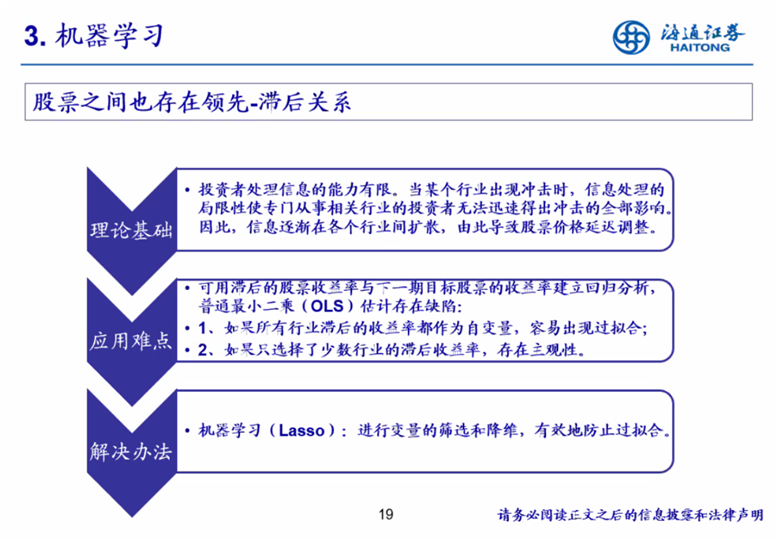
Next, Teacher Feng Jiarui introduced us to the application of machine learning in stock return prediction. When an industry experiences a shock, investors may not be able to react immediately and may have a certain lag effect. The difficulty of applying regression analysis lies in the overfitting caused by too many independent variables. Therefore, machine learning is considered for feature selection, such as post lasso. Statistical inference after selection. Firstly, the regression coefficient values of variables with non-zero coefficients are selected through lasso, and then a least squares regression is retrained using these features. However, the economic logic of using lasso for feature selection remains to be verified. Following that, Teacher Feng explained an example of Lasso for feature selection to the students. The total number of times the bank is selected in the example ranks among the top 5 in all industries, and the bank itself is an important financial intermediary, indicating that Lasso's coefficient selection has a certain effect. However, some variables have insignificant Lasso regression coefficients, indicating a low ability to predict lag. If 0 variables are ultimately selected, there are two methods to handle them: the first is to not handle them, that is, to use the intercept term of the regression model; The second method is to use the mean of momentum instead. Then Teacher Feng introduced the sensitivity analysis of hyperparameters to the students, that is, the training period length and the duration used in the momentum method need to be adjusted to make the final model coefficients more robust.
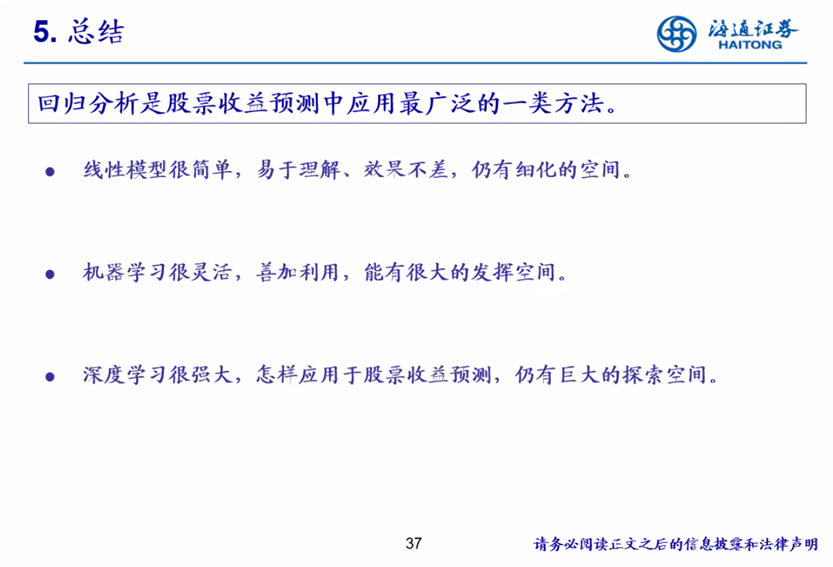
Next, Teacher Feng Jiarui briefly introduced the application of deep learning, which uses LSTM models to predict the rise and fall of stocks on the next trading day, but the prediction effect is average. Finally, Teacher Feng Jiarui summarized that regression analysis is still the most widely used method for predicting stock returns. Linear models are simple, easy to understand, and have good performance, but there is still room for refinement. Machine learning is very flexible, and if utilized effectively, it will have great potential for development. Deep learning is powerful, but its explanatory and predictive abilities need further improvement.
During the questioning session, students enthusiastically asked Teacher Feng questions. A classmate asked about the practical application of principal component analysis, and Teacher Feng provided a detailed answer. Teacher Feng stated that using principal component analysis is not conducive to the interpretation of the model. Another student asked about the selection of model interpretation ability and prediction accuracy in financial engineering, and Teacher Feng patiently answered the question.
In this industry forum lecture, Professor Feng Jiarui gave a lecture on the application of regression analysis, machine learning, and deep learning in stock return prediction. The students gained a lot and gained more understanding and knowledge about the methods of stock return prediction in the industry.
Author: Cheng Yuanyuan
Image provided by: Wu Hao